Authors: Erik Backstrom, B.S., Maura McCartney, M.S. Morgan McClellan, M.S., Ronald J. Fijalkowski, Ph.D.
Introduction:
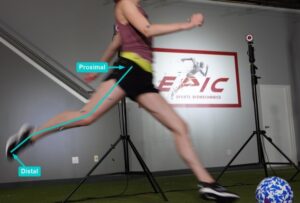
High-level athletes make incredibly difficult movements look easy. Our biomechanical skill assessments examine an athlete’s sport-specific movement quality and their physical attributes. The results drive individualized performance programs. Our team often uses a principle known as the “summation of speeds” when analyzing athletic movements. This approach models the body as interconnected segments, where the joints are the links in a chain amongst segments. In order to maximize the output speed or velocity an athlete can attain, movement must build along the chain. The interaction amongst the chain links and segments is dictated by the timing and speed of the chain link and segment adjacent to it. Ideally, each chain link and segment start its motion at the instant of maximum velocity of the preceding chain link and segment. It is this progressive growth amongst the chain links and segments that allows the athlete to maximize their output at the end of the chain. The beginning (proximal segment) and end (distal segment) of the chain links and segments varies by sport. In soccer, the end of the chain is the foot, while the beginning is the core (Figure 1). Core stability and a stretch-shortening cycle accelerates the upper leg, while the lower leg gains speed through knee extension and the foot (distal segment) whips toward the ball at an increased velocity. Golfers develop speed through their foot-ground interaction which can progressively increase through efficient movement of their chain links and segments that consist of the pelvis, core, chest, and arms, eventually maximizing the speed of their hands (Figure 2). Therefore, the “summation of speeds” principle plays a critical role in maximizing an athlete’s performance output and reducing their injury risk across a variety of sports, including baseball/softball, golf, lacrosse, soccer, tennis, and volleyball (Figure 3).
 |
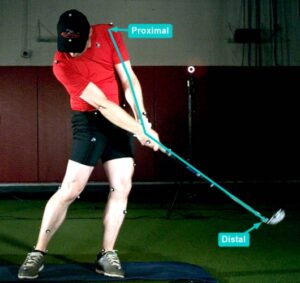 |
Figure 1: Soccer-based “summation of speed” |
Figure 2: Golf-based “summation of speed” |
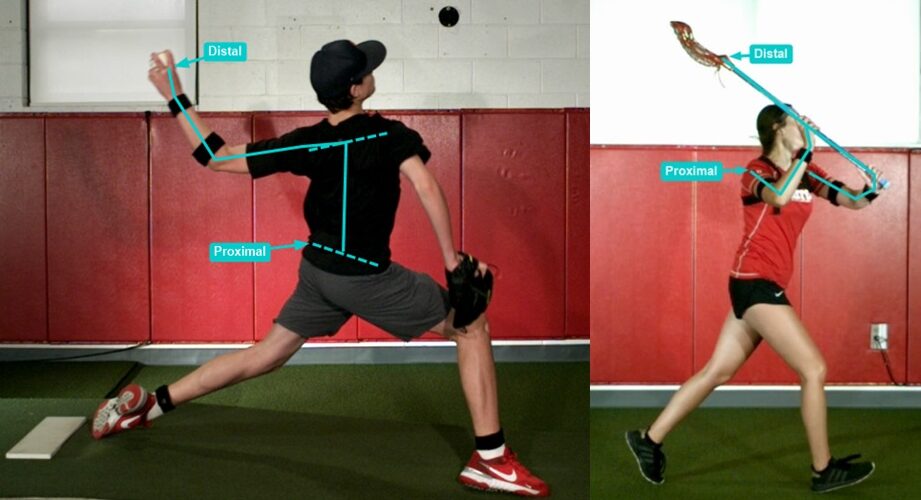 |
Figure 3: Pitching-based and lacrosse-based “summation of speed.” |
Method:
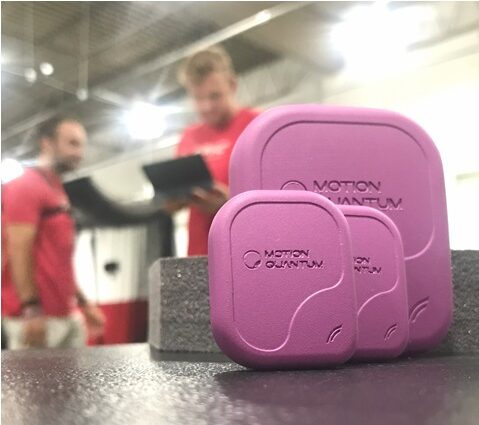
We often use our Inertial Measurement Units (IMUs) to analyze an athlete’s movements (Figure 4). Our IMUs are wearable sensors which contain an accelerometer and a gyroscope, allowing us to track the three-dimensional positions, velocities, and accelerations of an athlete’s “links”. For a baseball pitcher, we’ll frequently use an 8-sensor configuration which enables us to analyze how well the pitcher uses the ground through their legs (1-4) and generates power in order to move the pelvis (5), torso (6), upper arm (7), and forearm (8) in a proximal-to-distal rotation sequence (Figure 5). These are the details that cannot be seen with the naked eye or slow-motion video, and are essentially unavailable to coaches without this type of assessment. While each IMU captures data independently, their interactions as a system allow a more in-depth analysis. For example, the angular differences between sensors 5 and 6 on our pitcher (Figure 5) in the three planes of motion equate to forward and lateral flexion of the trunk and hip-shoulder separation angle.
 |
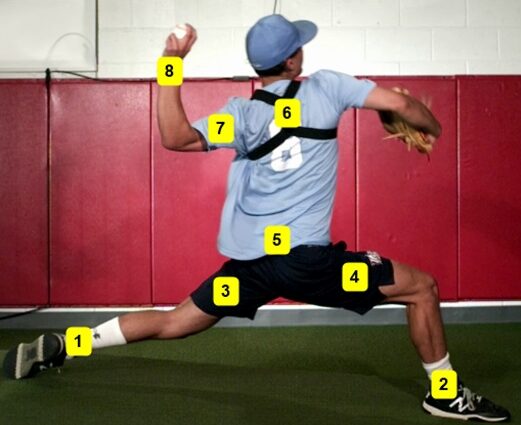 |
Figure 4: Inertial measurement units (IMUs). |
Figure 5: 8-sensor IMU configuration. |
Discussion:
Among athletes who achieve equivalent output performance velocities, those that have lower-magnitudes (velocities and accelerations) are inherently more efficient movers. Less efficient athletes will rely on one area of their body or another, thereby applying greater stress (forces and moments) to the joints between the chain links. For example, a baseball pitcher’s output is defined by their foot-ground interaction, pelvis, chest, upper arm, and lower arm, that drives greater hand velocity. Inefficiencies present in the trunk can result in increased stress at the shoulder and/or elbow that can lead to injury.
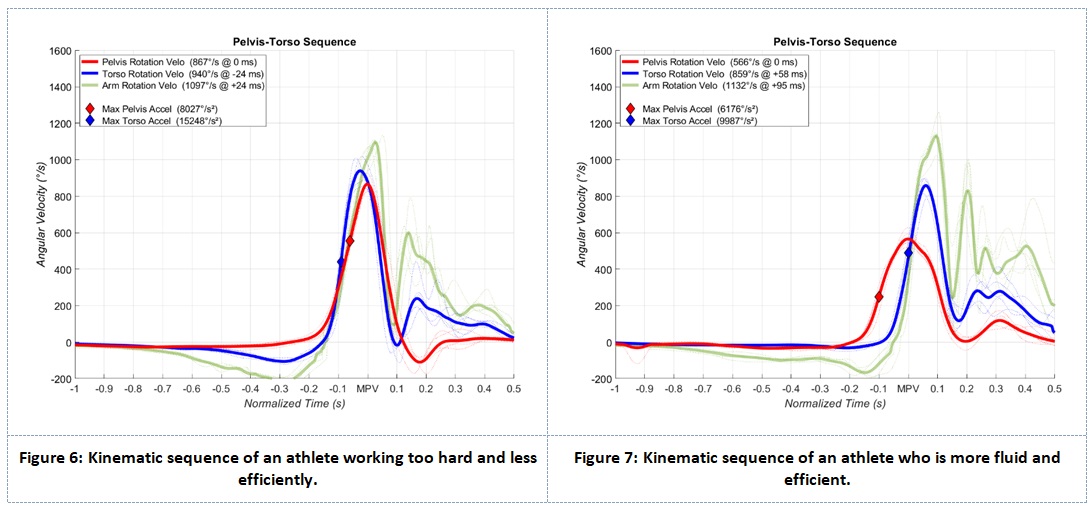
Our IMU-based biomechanical assessment uncovers these types of inefficiencies (Figures 6 and 7). The athlete’s data at the left (Figure 6) has higher magnitudes of pelvis (red lines) and torso (blue lines) rotational velocity than the athlete on the right (Figure 7). However, the arm rotational velocities (green lines) of both athletes are essentially identical. The athlete at the left (Figure 6) is therefore working harder and less efficiently than the athlete at the right (Figure 7). A significant difference in the timing of the torso is apparent: the athlete on the left reaches maximum torso rotational velocity 24 milliseconds before maximum pelvis rotational velocity, resulting in only a 73°/s difference in speed between the two segments. The athlete on the right, however, displays a desired time lag of 58 milliseconds between the pelvis and torso, resulting in a rotational velocity gain of nearly 300°/s. Overall, the athlete on the right gains 336°/s more rotational velocity from the pelvis to the arm than the athlete on the left, indicating a significantly more efficient sequence. This athlete would be expected to exhibit lower forces and torques on the low back and shoulder primarily, as well as a greater ability to make future performance improvements.
Not all is lost for the athlete on the left (Figure 6), however! The IMU-based biomechanical assessment pairs with physical tests to evaluate functional movement, flexibility, and strength. The physical attributes of an athlete are often the root cause of inefficiencies. For example, an athlete may have significant thoracic tightness that prevents sufficient rotational separation of the pelvis and torso. This is where our individualized development programs become critical as they address both physical limitations and mechanical inefficiencies.
Limitations:
While IMUs are a great tool for biomechanical analysis, the “gold standard” is our marker-based motion capture system. Athletes who complete a motion capture assessment with us wear approximately 40 photo-reflective markers that are tracked by surrounding infrared cameras to under a half-millimeter of error. This adds an incredible level of accuracy and enables our team to quantify joint forces and torques. Additionally, we capture IMU data at a sampling rate of 200 Hz, slightly lower than the motion capture standard range of 240-300 Hz. The IMUs are sufficient for measuring the majority of athletic movements, but may lead to slight inaccuracies when capturing at very high speeds or in specifying events that occur within 5 milliseconds or less. Nonetheless, both systems allow us to capture movement in three dimensions, measure joint angles, evaluate the interaction of various body segments, and identify mechanical inefficiencies. Studies within the last few years have shown IMU analyses to be a promising alternative, especially in situations where using markered motion capture is not feasible.
Technical Specifications:
Raw data from the IMU system is exported and post-processed using proprietary MATLAB-based code. Displacement and velocity data are provided by the IMU output, while derivative metrics such as knee flexion/extension velocity and pelvis rotational acceleration are calculated using a five-point stencil numerical differentiation method. We have also developed our own metrics based on the available information. For example, we use an Euler angle method to calculate “postural deviation,” defined as the three-dimensional angular difference between the pelvis and torso. The postural deviation angle equates to the amount of bend in the spine in any direction relative to a neutral position; a high postural deviation angle during torso rotation may indicate poor core stability and a larger amount of stress placed on the lumbar spine and surrounding musculature.
Wearable sensors can shift during high-speed movement, introducing noise. A Savitzky-Golay filter is applied to smooth the affected data and visualize the signal. The data is normalized to account for variations in the time window amongst captures. Comparatively, we normalize the data to an event such as “ball release” or “contact” when using our marker-based motion capture system. While we can usually identify these external markers through acceleration pulses in the IMU data, the desired level of accuracy for normalization is not available. In the case of a pelvis-torso-arm-hand kinematic sequence for example, we normalize the data to the occurrence of maximum pelvis rotational velocity. This approach allows a closer examination of the segment interaction relative to the most proximal segment in the sequence. Figure 7 is representative of an efficient sequence with the pelvis reaching maximum rotational velocity (MPV) at the normalized 0 milliseconds followed by the torso peaking at MPV + 58 milliseconds, and the arm peaking at MPV + 95 milliseconds. Contact occurred at MPV + 100 milliseconds.